Introduction
Data analysis is the process of collection, transformation, and organization of data in order to draw conclusions, make predictions, and drive informed decision-making.
Some specific types of data analysis include:
- Descriptive analysis
- Diagnostic analysis
- Predictive analysis
- Prescriptive analysis
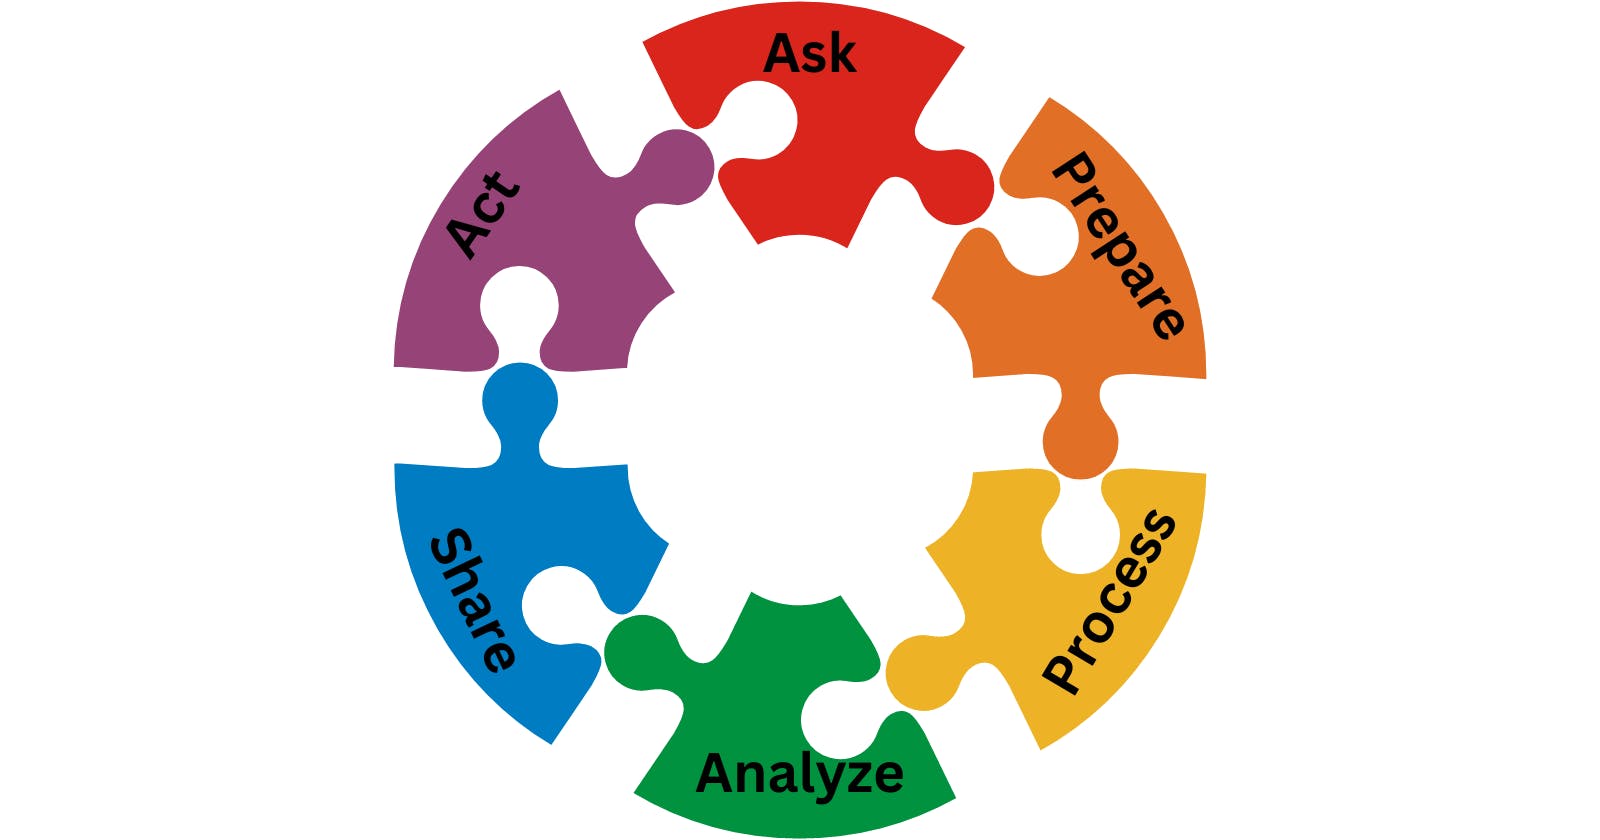
Regardless of your reason for analyzing data, there are six simple steps that you can follow to make the data analysis process more efficient: Ask, Prepare, Process, Analyze, Share, and Act. In this blog post, I will explore each of these steps in detail and explain how they contribute to effective data analysis.
1. Ask the right questions and define the problem
The first step in the data analysis process is to clearly define the problem that needs to be addressed and identify the desired outcome. This step sets the stage for the entire analysis and ensures that the subsequent steps are focused on the most important aspects of the problem. By asking precise questions, you can ensure that your analysis is targeted and focused. To achieve this, it is essential to understand the stakeholders' expectations. Effective communication with stakeholders is vital to keep the focus on the project's goals and develop a robust strategy to achieve them.

Some questions to ask when searching for a solution:
What is the problem that I'm trying to solve?
What is the purpose of this analysis?
What am I hoping to learn from it?
What is the root cause of a problem?
When it comes to identifying the root cause of a problem, the "5 Whys" rule can be very useful. By asking "why?" repeatedly, you can uncover underlying issues that may not be immediately obvious.
Where are the gaps in my process?
What did I not consider before?
2. Gather and store data
In the current era of rapidly increasing data generation, we are witnessing exponential growth in the volume of available data.

Here are some common ways in which data is generated:
Data generated by users interacting with websites, apps, and devices, such as clicks, views, downloads, and purchases.
Social media platforms generate a massive amount of data through user posts, likes, comments, and shares.
IoT devices, sensors, smart appliances, and wearables generate data continuously.
Data generated as part of routine business operations, such as sales transactions, inventory management, and customer service interactions.
Data can be generated through research studies and experiments, such as clinical trials, surveys, and focus groups.
Mobile devices such as smartphones and tablets generate data through location tracking, app usage, and other activities.
In parallel, the techniques and technologies used for gathering data are continually advancing and evolving. With the enormous amount of data being generated every second, it is essential to have appropriate systems and tools in place to securely store it.
Here are some common ways of storing data:
Relational databases: A relational database is a type of database that organizes data into one or more tables with a unique key identifying each row. This is the most common type of database used in businesses and organizations.
NoSQL databases: NoSQL databases are designed to handle unstructured data that does not fit well into the rows and columns of a relational database. They are often used for big data and real-time applications.
File systems: A file system is a method of storing and organizing computer files and the data they contain. This is the most basic form of data storage and is often used for personal or small business data storage needs.
Cloud storage: Cloud storage refers to online storage solutions that allow users to store and access their data over the internet.
These are just a few examples of the different ways data can be stored. The choice of storage method depends on factors such as the amount and type of data, the performance requirements, and the budget available for storage solutions.
3. Process data by cleaning and checking the information

In this step, you clean the data to ensure its accuracy and completeness. The data gathered may contain errors, inconsistencies, outliers or missing values, making it difficult to analyze. Therefore, the data needs to be cleaned, meaning that any errors or inconsistencies need to be corrected, and any missing values need to be filled in. This step involves also combining multiple datasets to gain a complete understanding of the situation.
By ensuring that the data is accurate, consistent, and reliable, analysts can generate meaningful insights and make informed decisions.
Overall, cleaning data is a time-consuming but crucial step in the data analysis process.
4. Analyze data

After cleaning your data and running all quality assurance checks, now is the point where you analyze your data, making sure to do it in an objective and unbiased manner. The first thing to do is to run through a series of analyses that you've already planned ahead of time based on the questions that you know you want to answer from the very, very beginning of the process.
In this step, appropriate statistical and visualization techniques have to be used to analyze the data and draw meaningful conclusions, make predictions, and informed decisions. Some of the tools commonly used by data analysts include spreadsheets, structured query language (SQL), programming languages like Python and R, and data visualization tools. These tools help to explore patterns, and relationships, identify trends and anomalies, and uncover insights that would be difficult to see in raw data. The choice of tool depends on the nature and complexity of the data, the research question, and the skill set and preference of the data analyst.
5. Share your findings and insights

In this step, you communicate your findings and insights to stakeholders. You need to prepare clear and concise reports, dashboards, or presentations that effectively communicate the results of the analysis.
6. Make decisions and take action

In this final step, the insights gained from the analysis are used to make informed decisions and take action. The results of the analysis will help to identify opportunities, mitigate risks, or optimize processes.
Conclusion
The six steps of data analysis provide a systematic approach to exploring and interpreting data to gain insights and make informed decisions. By following these steps, you can ensure that your analysis is rigorous, accurate, and effective in delivering value to stakeholders.
